HFpEF Phenomapping
Novel methods for phenomapping in HFpEF
Why phenomapping?
In 2015, Shah (@HFpEF) published seminal work showing clustering techniques could identify unique subgroups among patients with HFpEF. However, recent machine learning based techniques now allow for clustering of both continuous AND categorical data directly.
Our Methods
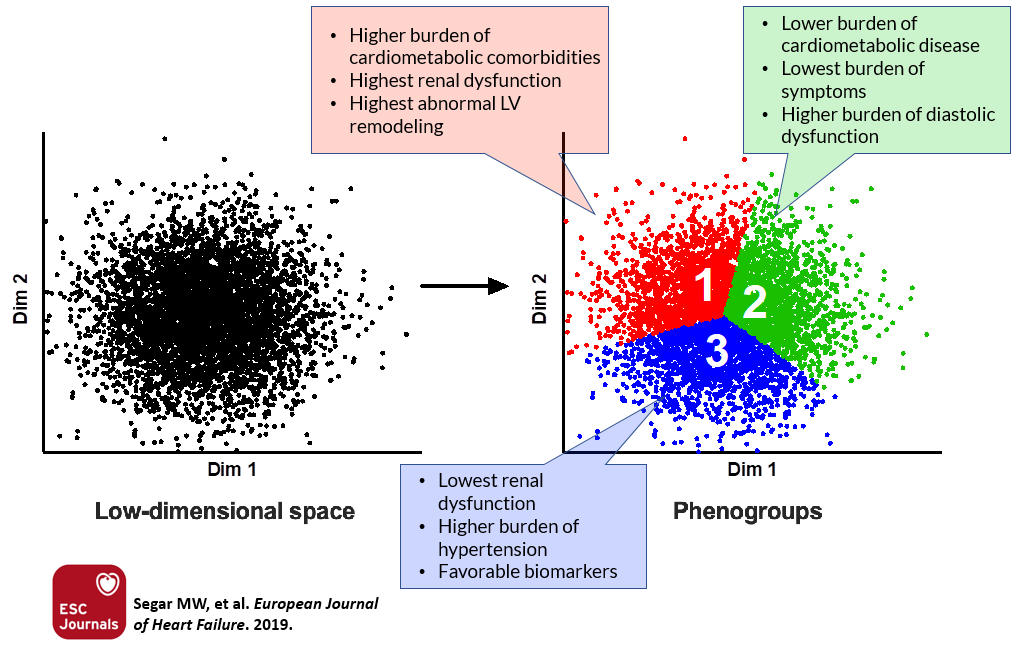
In this study, we used data from the TOPCAT trial encompassing over 150 mixed-data candidate variables to identify 3 novel HFpEF subgroups. We further externally validated the identified phenogroups using data from the RELAX trial.
Findings
Phenogroup 1 - increased burden of comorbidities, NP levels, and abnormal LV structure/function.
Phenogroup 2 - intermediate burden of CV comorbidites, but increased rates of diastolic dysfunction.
Phenogroup 3 - decreased NP levels, intermediate CV comorbidities, and favorable diastolic dysfunction.
Each with unique survival profiles!